import matplotlib.pyplot as plt
import pandas as pd
import numpy as np
%matplotlib inline
austin_weather = pd.read_csv('../data/austin_weather.csv')
seattle_weather = pd.read_csv('../data/seattle_weather.csv')austin_weather.head()| DATE | STATION | NAME | MLY-CLDD-BASE45 | MLY-CLDD-BASE50 | MLY-CLDD-BASE55 | MLY-CLDD-BASE57 | MLY-CLDD-BASE60 | MLY-CLDD-BASE70 | MLY-CLDD-BASE72 | ... | MLY-TMIN-AVGNDS-LSTH070 | MLY-TMIN-NORMAL | MLY-TMIN-PRBOCC-LSTH016 | MLY-TMIN-PRBOCC-LSTH020 | MLY-TMIN-PRBOCC-LSTH024 | MLY-TMIN-PRBOCC-LSTH028 | MLY-TMIN-PRBOCC-LSTH032 | MLY-TMIN-PRBOCC-LSTH036 | MLY-TMIN-STDDEV | MONTH | |
|---|---|---|---|---|---|---|---|---|---|---|---|---|---|---|---|---|---|---|---|---|---|
| 0 | 1 | USW00013904 | AUSTIN BERGSTROM INTERNATIONAL AIRPORT, TX US | 190 | 103 | 50 | 35 | 18 | 1 | -7777 | ... | 310 | 36.3 | 298 | 570 | 839 | 967 | 997 | 1000 | 2.9 | Jan |
| 1 | 2 | USW00013904 | AUSTIN BERGSTROM INTERNATIONAL AIRPORT, TX US | 228 | 132 | 68 | 49 | 29 | 3 | 1 | ... | 280 | 39.4 | 103 | 327 | 614 | 867 | 973 | 999 | 3.2 | Feb |
| 2 | 3 | USW00013904 | AUSTIN BERGSTROM INTERNATIONAL AIRPORT, TX US | 446 | 306 | 185 | 146 | 98 | 13 | 6 | ... | 308 | 46.6 | 10 | 73 | 242 | 494 | 761 | 928 | 3.6 | Mar |
| 3 | 4 | USW00013904 | AUSTIN BERGSTROM INTERNATIONAL AIRPORT, TX US | 668 | 519 | 373 | 318 | 240 | 53 | 32 | ... | 287 | 54.7 | 0 | 0 | 0 | 48 | 189 | 453 | 4.1 | Apr |
| 4 | 5 | USW00013904 | AUSTIN BERGSTROM INTERNATIONAL AIRPORT, TX US | 936 | 781 | 626 | 564 | 471 | 181 | 134 | ... | 250 | 63.7 | 0 | 0 | 0 | 0 | 0 | 0 | 2.5 | May |
5 rows × 68 columns
seattle_weather.head()| DATE | STATION | NAME | MLY-CLDD-BASE45 | MLY-CLDD-BASE50 | MLY-CLDD-BASE55 | MLY-CLDD-BASE57 | MLY-CLDD-BASE60 | MLY-CLDD-BASE70 | MLY-CLDD-BASE72 | ... | MLY-TMIN-AVGNDS-LSTH070 | MLY-TMIN-NORMAL | MLY-TMIN-PRBOCC-LSTH016 | MLY-TMIN-PRBOCC-LSTH020 | MLY-TMIN-PRBOCC-LSTH024 | MLY-TMIN-PRBOCC-LSTH028 | MLY-TMIN-PRBOCC-LSTH032 | MLY-TMIN-PRBOCC-LSTH036 | MLY-TMIN-STDDEV | MONTH | |
|---|---|---|---|---|---|---|---|---|---|---|---|---|---|---|---|---|---|---|---|---|---|
| 0 | 1 | USW00094290 | SEATTLE SAND PT WSFO, WA US | 27.0 | 3.0 | -7777.0 | -7777.0 | 0.0 | 0.0 | 0.0 | ... | 310.0 | 37.0 | 64.0 | 129.0 | 317.0 | 709.0 | 959.0 | 1000.0 | 2.3 | Jan |
| 1 | 2 | USW00094290 | SEATTLE SAND PT WSFO, WA US | 31.0 | 3.0 | -7777.0 | -7777.0 | 0.0 | 0.0 | 0.0 | ... | 280.0 | 36.9 | 15.0 | 76.0 | 273.0 | 616.0 | 917.0 | 1000.0 | 2.6 | Feb |
| 2 | 3 | USW00094290 | SEATTLE SAND PT WSFO, WA US | 81.0 | 16.0 | 2.0 | -7777.0 | -7777.0 | 0.0 | 0.0 | ... | 310.0 | 39.3 | 0.0 | 20.0 | 41.0 | 152.0 | 670.0 | 986.0 | 1.8 | Mar |
| 3 | 4 | USW00094290 | SEATTLE SAND PT WSFO, WA US | 169.0 | 58.0 | 12.0 | 6.0 | 1.0 | 0.0 | 0.0 | ... | 300.0 | 42.5 | 0.0 | 0.0 | 0.0 | 0.0 | 114.0 | 711.0 | 1.5 | Apr |
| 4 | 5 | USW00094290 | SEATTLE SAND PT WSFO, WA US | 343.0 | 193.0 | 78.0 | 49.0 | 21.0 | -7777.0 | -7777.0 | ... | 310.0 | 47.8 | 0.0 | 0.0 | 0.0 | 0.0 | 0.0 | 58.0 | 1.9 | May |
5 rows × 81 columns
Weather Patterns in Seattle and Austin
plt.style.use('ggplot')
fig, ax = plt.subplots(figsize=(14,6))

# Plot MLY-PRCP-NORMAL from seattle_weather against the MONTH
ax.plot(seattle_weather["MONTH"], seattle_weather['MLY-PRCP-NORMAL'], c='blue', marker='o', linestyle='dashdot')

# Plot MLY-PRCP-NORMAL from austin_weather against MONTH
ax.plot(austin_weather['MONTH'], austin_weather['MLY-PRCP-NORMAL'], c='red', marker='v', linestyle='--')

ax.set_xlabel('Time (months)')
ax.set_ylabel('Precipitation (inches)')
ax.set_title('Weather patterns in Seattle and Austin')

plt.show()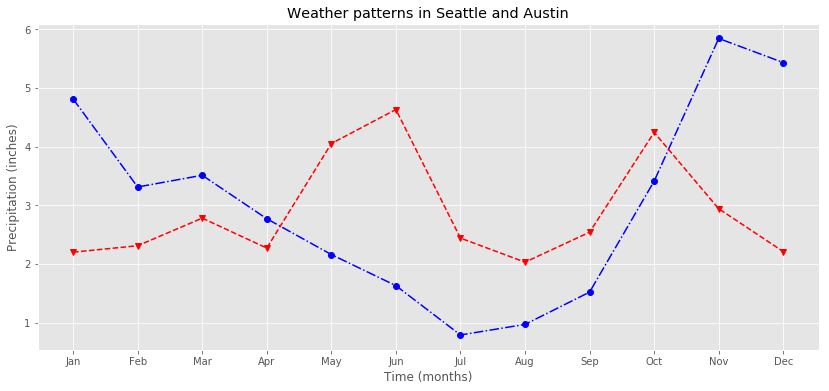
Monthly Precipitation and Temperature in Seattle and Austin
fig,ax=plt.subplots(2,2, sharey=True, figsize=(15,4))
ax[0,0].plot(seattle_weather['MONTH'], seattle_weather['MLY-PRCP-NORMAL'])
ax[0,1].plot(seattle_weather['MONTH'], seattle_weather['MLY-TAVG-NORMAL'])
ax[1,0].plot(austin_weather['MONTH'], austin_weather['MLY-PRCP-NORMAL'])
ax[1,1].plot(austin_weather['MONTH'], austin_weather['MLY-TAVG-NORMAL'])
plt.show()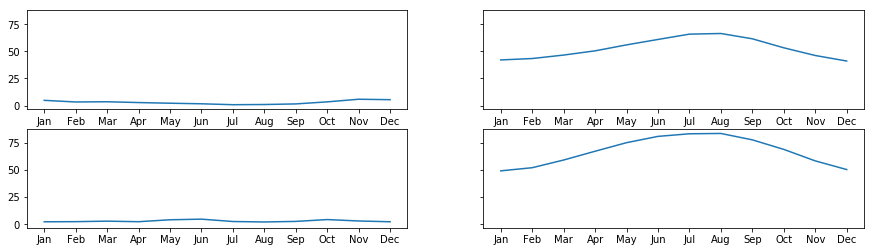
Precipitation data in Seattle and Austin
# Create a figure and an array of axes: 2 rows, 1 column with shared y axis
fig, ax = plt.subplots(2, 1, sharey=True)

# Plot Seattle precipitation data in the top axes
ax[0].plot(seattle_weather['MONTH'], seattle_weather['MLY-PRCP-NORMAL'], color = 'b')
ax[0].plot(seattle_weather['MONTH'], seattle_weather['MLY-PRCP-25PCTL'], color = 'b', linestyle = '--')
ax[0].plot(seattle_weather['MONTH'], seattle_weather['MLY-PRCP-75PCTL'], color = 'b', linestyle = '--')

# Plot Austin precipitation data in the bottom axes
ax[1].plot(austin_weather['MONTH'], austin_weather['MLY-PRCP-NORMAL'], color = 'r')
ax[1].plot(austin_weather['MONTH'], austin_weather['MLY-PRCP-25PCTL'], color = 'r', linestyle = '--')
ax[1].plot(austin_weather['MONTH'], austin_weather['MLY-PRCP-75PCTL'], color = 'r', linestyle = '--')

plt.show()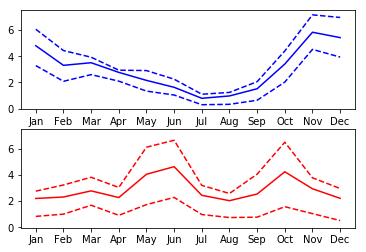
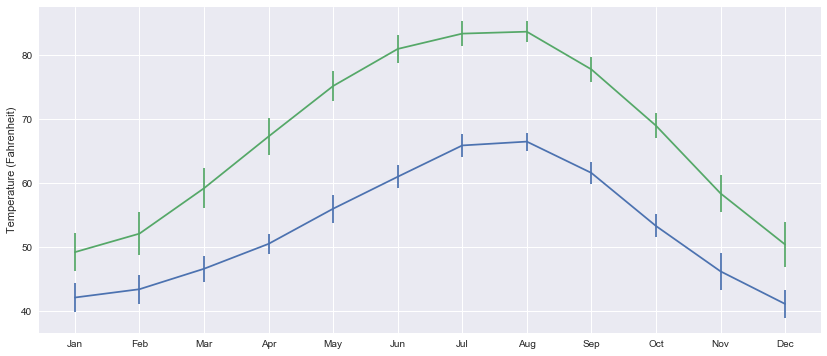
Adding error-bars
plt.style.use('seaborn')
fig, ax = plt.subplots(figsize=(14,6))
ax.errorbar(seattle_weather['MONTH'], seattle_weather['MLY-TAVG-NORMAL'],yerr=seattle_weather['MLY-TAVG-STDDEV'])
ax.errorbar(austin_weather['MONTH'], austin_weather['MLY-TAVG-NORMAL'],yerr=austin_weather['MLY-TAVG-STDDEV'])
ax.set_ylabel('Temperature (Fahrenheit)')
plt.show()